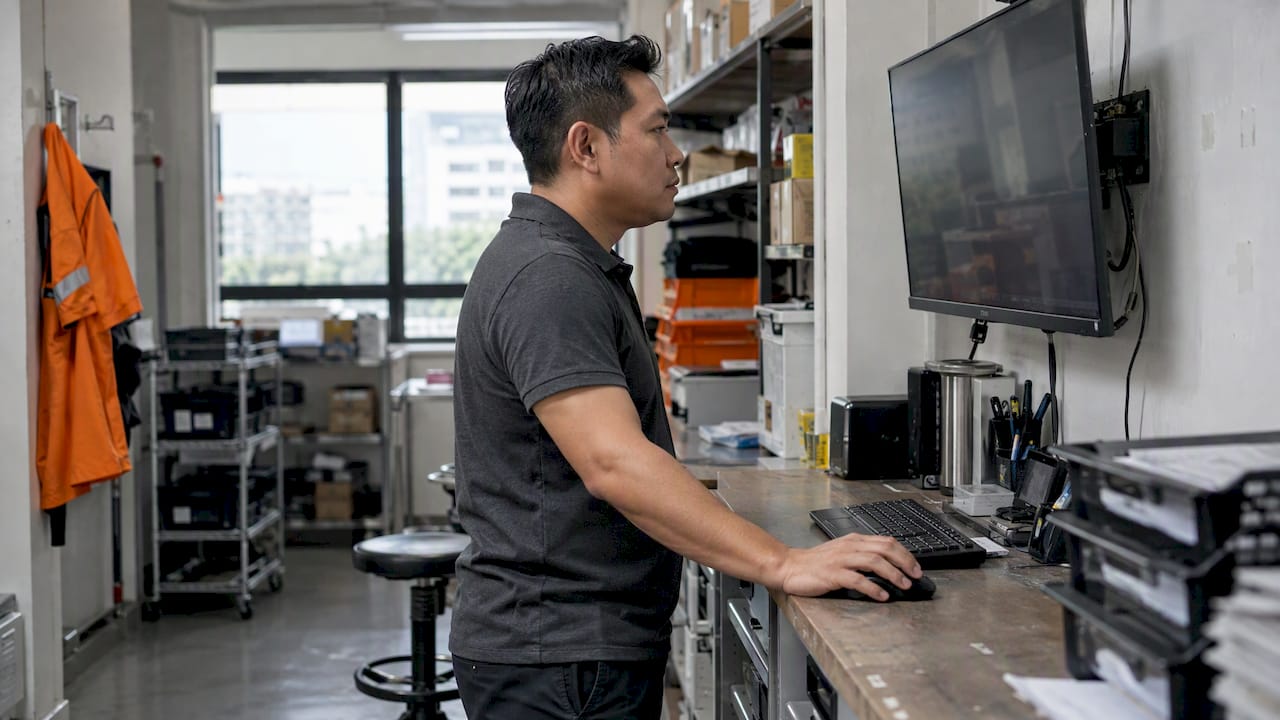
A good operations dashboard shows five to eight numbers that tell you whether work is flowing, where it is stuck and what needs your attention today. For most Singapore SMEs, those numbers are throughput time, error rate, on-time delivery, first time right, queue or waiting time, and workload against capacity. Everything else is a nice-to-have.
This guide gives you the metrics, the formulas, a layout you can copy and the design rules that stop a dashboard becoming wallpaper. It is written for owners and managers, not data teams.
TL;DR
- Pick metrics that trigger a decision. If nobody would act when a number moves, remove it.
- Start with 5 to 8 operational metrics: throughput time, error rate, on-time delivery, first time right, waiting time, and volume against capacity.
- Keep financial KPIs on a separate view. They show the snapshot, not where work is stuck.
- Get the data out of manual spreadsheets early. Re-keying is where most dashboards die.
- Track processes, not individuals, and tell your staff what you collect and why.
Table of Contents
- Start with the decisions, not the chart types
- The core operations KPIs, with formulas
- Operations KPI examples by type of business
- Management dashboard examples: three layouts that work
- Do financial KPIs belong on the same dashboard?
- Dashboard design best practices
- Why the data source matters more than the chart
- Tracking people: keep it about the process
- Our perspective: fewer metrics, closer to the work
- Where FlowLab fits
- A four-week plan to launch your first dashboard
- Common mistakes to avoid
- FAQ
- Sources
Start with the decisions, not the chart types
Most dashboard projects begin with a tool and a blank canvas. We suggest the opposite order. Write down the five recurring decisions you or your managers make in a week. For example:
- Who do I move onto today’s backlog?
- Which orders will miss their promised date?
- Do I need extra counter staff this afternoon?
- Which leads have gone quiet for a week?
- Which step of the process keeps sending work back?
Each decision needs one or two numbers. That list is your dashboard. If a metric supports none of the decisions, it belongs in a monthly report at most.
This matches how others describe useful dashboards. One consultancy’s guide to weekly operational views says dashboards should enable decisions, by showing where work is stuck and where leadership attention is needed.
The core operations KPIs, with formulas
A Swiss lean consultancy, swisslean, lists essential process metrics for SMEs including throughput time, error rate, on-time delivery and first time right. These work in almost any sector, which is why they form the backbone below. We have added waiting time and capacity, which we see matter most in service businesses.
| Metric | What it tells you | Simple formula | Check |
|---|---|---|---|
| Throughput time | How long work takes from start to finish | Completion time minus start time, averaged | Daily or weekly |
| On-time delivery % | Whether you keep promises | Jobs delivered by the promised date ÷ all jobs | Daily |
| Error rate | How often something is faulty or wrong | Faulty jobs ÷ all jobs | Weekly |
| First time right % | Work finished without rework | Jobs with no rework loop ÷ all jobs | Weekly |
| Waiting time | How long customers or jobs sit idle | Time from arrival to start of service | Live or daily |
| Volume vs capacity | Whether you are over or under stretched | Jobs in progress ÷ jobs your team can handle | Daily |
A few notes on using them.
Use medians as well as averages. One job that stalls for three weeks distorts an average. Show the average and the slowest 10% of jobs, or the median beside it.
Define each metric in one sentence. “On time” means different things to sales and to the warehouse. Agree the definition once and put it under the number.
Show the target next to the figure. A number without a target forces the reader to guess whether it is good.
Operations KPI examples by type of business
The right mix depends on what you sell. These are starting points, not a template to adopt wholesale.
Retail and F&B counters
- Transactions per hour, by outlet and by time of day
- Average basket value
- Voids and refunds as a share of sales (an early signal of process or training problems)
- Stock-outs on your top 20 items
- Queue time at peak
Appointment and service businesses
- Average wait from check-in to being served
- No-show rate
- Service time against the time you booked
- Customers served per staff member per shift
- Walk-aways, meaning customers who join a queue and leave
Events and registrations
- Registrations against target, by day
- Check-in speed at the door
- Attendance rate (turned up ÷ registered)
- Last-minute changes and cancellations
Sales and lead handling
- New leads per week, by source
- Time to first response
- Leads with no follow-up in 7 days
- Lead-to-quote and quote-to-order rates
Project, trade and fulfilment businesses
- Jobs open, due this week, overdue
- Average days from order to completion
- Rework or callback rate
- Materials waiting on supplier
Attendance and workforce capacity
- Staff present against rostered, by site and shift
- Late arrivals and absences at team level
- Hours available against hours of work booked
Treat this last category carefully. See the section on privacy below.
Management dashboard examples: three layouts that work
Here are three layouts we think suit an SME. Each fits on one screen.
1. The owner’s morning view
Six tiles across the top: orders today, overdue jobs, on-time delivery % this week, error rate this week, cash received today, and open customer complaints. Below, one list: the five jobs most at risk of missing their date. You open it at 8.30am and know where to spend your first hour.
2. The floor or counter view
What is happening now. Current queue length, longest wait, staff on shift, jobs in progress by stage. This version refreshes through the day and is often shown on a wall screen. It is for the people doing the work, so keep it plain and large.
3. The weekly management view
Trends over eight to twelve weeks: throughput time, first time right, on-time delivery, volume against capacity. Add a short comment box for the manager to write what changed and what was done. The comment is as valuable as the chart, because it builds a record of cause and effect.
Do financial KPIs belong on the same dashboard?
Keep them nearby, but not mixed in. Liquidity, receivables and profitability matter. The Swiss federal SME portal, for instance, lists liquidity control, debtor control, stock and profitability as the key figures for monitoring company finances. But they are a snapshot of the past. They will not tell you that your workshop has a three-day backlog building up this week.
For weekly control, put cash received, cash due and overdue invoices in one small block, and let the operational metrics lead the page.
Dashboard design best practices
Design is where good metrics get wasted. These rules are simple, and they work.
- Put the answer at the top. The reader should know within five seconds whether today is normal. Use a few large numbers with a clear good, watch or bad status.
- Limit the page. Eight tiles is plenty. If you need more, create a second view for a second audience.
- Use colour sparingly. Reserve red for “act now”. If everything is red or everything is green, nobody reads it.
- Choose the plainest chart. Lines for trends, bars for comparisons, a table for lists of jobs. Skip 3D charts and gauges.
- Show the last updated time. A dashboard people cannot trust is worse than none.
- Let people click through to the record. A number that says 14 overdue jobs should open the 14 jobs.
- Design for the device in use. A counter view on a tablet or wall screen needs bigger text than a desktop report.
- Review it every quarter. Remove metrics nobody used. Add the one people keep asking about.
One more rule: do not wait until it is perfect. The Swiss SME portal reports that hesitation about digitalisation is often tied to a wish to get everything right, while one expert there stresses that change comes step by step. A rough first version used for a month teaches you more than a polished one that launches in six.
Why the data source matters more than the chart
The most common reason SME dashboards fail is not design. It is that someone has to update them by hand.
A Swiss master’s thesis on a manufacturing site describes KPI steering that partly relied on manual Excel analysis, with a large effort for daily data collection. It estimated savings of up to 1,440 hours a year from automating it. That is one site, in one company, so treat the figure as an illustration, not a promise for your business.
A case study from smartMILE, a Swiss data consultancy, tells a similar story. In an industrial SME, lightweight data warehousing and dashboards were used to make KPIs reliable and cut the weekly reporting effort. Again, a single case, but the direction is common.
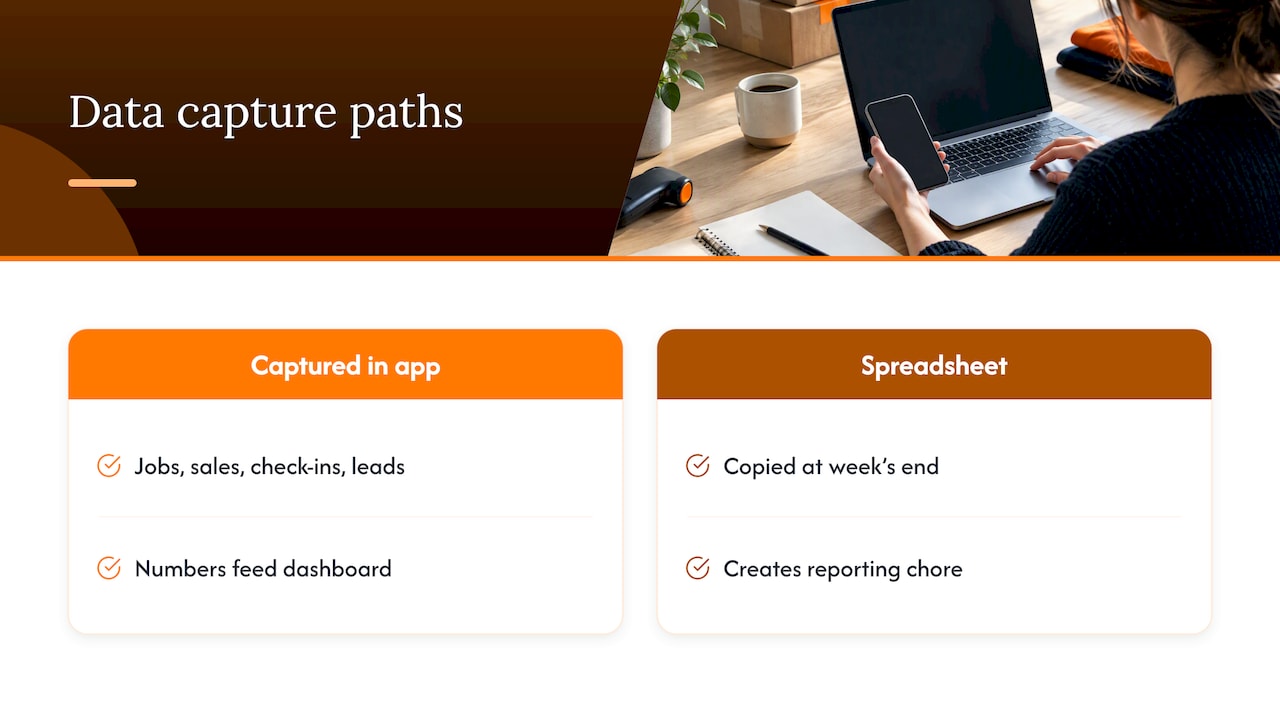
The practical lesson: capture data where the work happens. If staff already record a job, a sale, a check-in or a lead in an app, the dashboard gets its numbers for free. If they only record it in a spreadsheet at the end of the week, you are building a reporting chore.
The same principle applies in maintenance-heavy businesses. A maintenance software vendor explains how automated reporting dashboards turn work order and asset records into live figures, which is the same idea applied to equipment upkeep.
Tracking people: keep it about the process
Metrics such as attendance or tasks per person are easy to collect and easy to misuse. In Singapore, the Personal Data Protection Act sets out data protection obligations for organisations that collect personal data, and employee data is included. If your dashboard uses named staff data, check the obligations on that page, or speak to a lawyer or your data protection officer before you launch.
Whatever the legal minimum, some habits keep trust high:
- Aggregate by team, shift or site wherever you can.
- Tell staff what you collect and why before you start.
- Collect only what a decision needs.
- Use the dashboard to find process problems, such as a slow handover, not to rank individuals.
Our perspective: fewer metrics, closer to the work
We build internal tools and workflow apps for Singapore SMEs, and the same pattern repeats. A business asks for a dashboard. When we look at the workflow, the real problem is upstream: orders arrive on WhatsApp, get copied to a sheet, and nobody can say which are late.
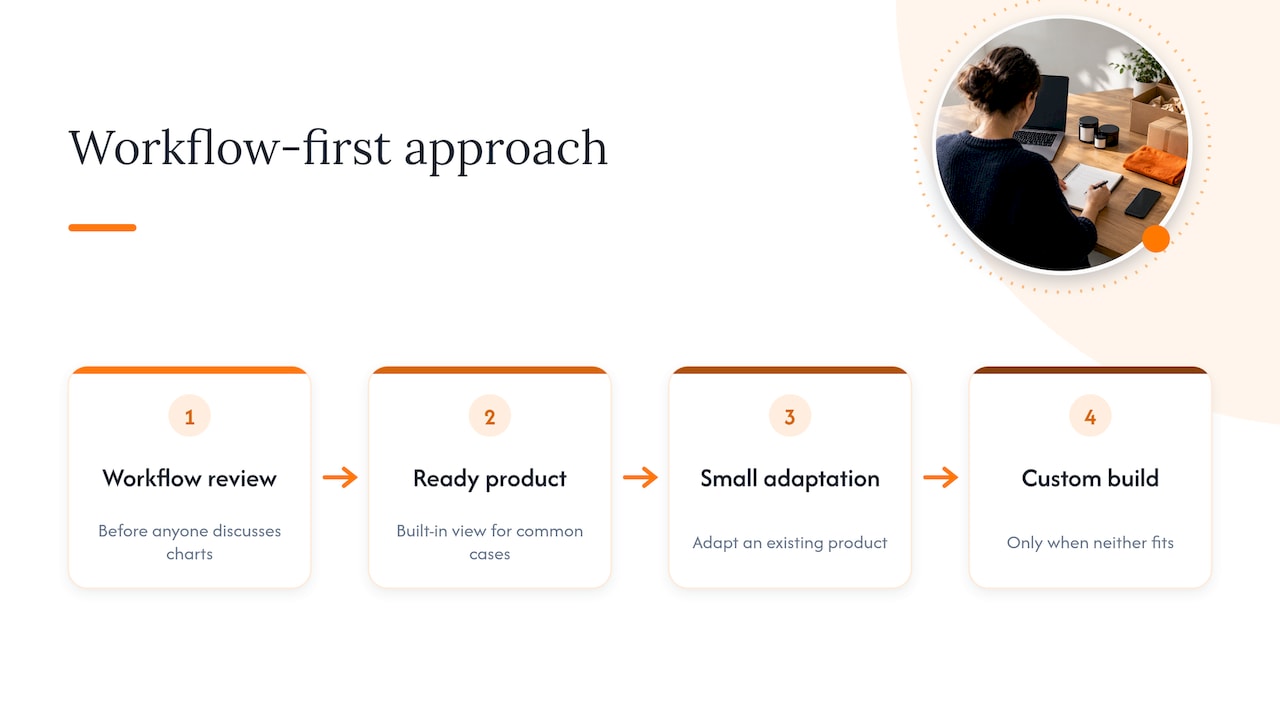
Our view is that the dashboard should be a by-product of a workflow that is already captured properly. That is why we start with a workflow-first review, before anyone talks about charts. Often the cheapest answer is a ready product with a built-in view: queue length and waiting time from a queue system, sales and voids from a point-of-sale system, lead follow-up from a lead tracker. Sometimes the answer is a small adaptation of one of those. Only when neither fits do we suggest a custom build, and we say so plainly.
We also think SMEs overbuild. Five numbers that are right and refreshed daily beat thirty that are approximate. If you cannot name the person who will act on a metric, drop it.
— Ronald
Where FlowLab fits
If your numbers live in spreadsheets, chat threads or paper forms, the quickest gain is usually capturing the work in one place. Our ready products cover common cases: QueueFlow for queues and waiting times, POSFlow for sales, LeadsFlow for lead follow-up and EventFlow for registrations. You can try some of them in the product demos first.
For processes that do not fit a standard product, we do internal tools development and workflow automation for SMEs. We begin with a free app fit review that identifies the simplest suitable solution and gives you an early view of costs before any development. Your information stays confidential. Talk to us about your workflow ↗
If you are weighing general-purpose platforms first, our notes on Airtable versus Smartsheet and Power Apps versus AppSheet cover when a managed build costs less.
A four-week plan to launch your first dashboard
Week 1: decisions and definitions. List the recurring decisions. Pick five to eight metrics. Write one sentence for each definition and one target.
Week 2: find the data. For each metric, answer: where is it recorded today, by whom, and how often? Mark the ones that depend on manual copying. Those are your risks.
Week 3: build a rough version. A simple sheet or a small app is fine. Show it to the three people who will use it and ask what they would change.
Week 4: use it in a real meeting. Run your weekly operations meeting from the dashboard. Note which metrics provoked a decision and which were ignored.
After a month, cut the ignored metrics, fix the data source that caused most delays, and decide whether the manual parts justify automation.
Common mistakes to avoid
- Too many metrics. A crowded page hides the one number that matters.
- Vanity numbers. Total orders ever, or page views, do not guide a decision.
- No owner. Every metric needs a named person who acts when it moves.
- Targets set once and never revisited. Review them every quarter.
- Mixing audiences. The owner, the floor team and an outside lender need different views.
- Surveillance by accident. If a chart can be read as a league table of staff, redesign it.
FAQ
What are common operational KPIs?
The most common are throughput time, on-time delivery, error rate, first time right, waiting time and capacity utilisation. Which you use depends on whether you sell products, appointments or projects. Start with the ones tied to a decision you make weekly.
How many metrics should an operations dashboard have?
Five to eight on the main view is a sound limit for an SME. More than that and readers stop scanning. Put detail on a second page that people open only when a headline number looks wrong.
What is the 5 second rule for dashboards?
It is a design test: a reader should grasp the main message within about five seconds. In practice, that means large headline numbers, clear status colours and the most important item at the top left. If someone needs a walkthrough, simplify.
Do I need a custom dashboard, or will a spreadsheet do?
A spreadsheet is fine while the data is small and one person updates it. It starts to fail when several people enter data, when you need live figures or when manual updating takes hours each week. At that point, a ready product or a small custom tool is usually cheaper than the time lost.
Sources
- Operational Dashboards: Weekly KPIs That Drive Action, Restrat Consulting
- 10 Kennzahlen, mit denen KMUs ihre Prozesse messen, swisslean
- Kennzahlen zur Unternehmensüberwachung, kmu.admin.ch
- Digitalisierung stellt KMU auf die Probe, kmu.admin.ch
- Live Data. Better Decisions, HSLU thesis
- Tableaux de bord de production pour une PME industrielle, smartMILE
- Data Protection Obligations, PDPC Singapore